| Dr Klein was
able to send us a baffling case of paranormal voice intrusion
that happened during a Skype conversation running between
Dr. Emanuel Toriello (ISARTOP chairman) and himself a year
ago or so. It is worth mentioning that Dr Toriello has experienced
this kind of anomolous interference several times. Listen
to sound file (1 min). Dr Klein submitted the file to
EVP expert Daniel Gulla who concluded that the voice was
not of human origin...read his report.
ANALYSES
OF "PARA-INTRUSION" SAMPLE
Daniele Gullà
SUBJECT:
Analyses performed on a sample recorded by Dr. Adrian Klein
from Israel concerning a noise interference, similar to
a verbal elocution, introduced during a phone conversation
through Skype communication system.
The electroacoustical analyses have been performed using
several software. Such analyses revealed the interfering
signal much more similar to a modulated noise than to a
human vocal articulation. In particular the sound seems
to be modulated in high wide frequency ranges with a constant
frequency change assimilable to a sound produced by a synthesizer.
In the following some spectral analyses and main characteristics
are reported.

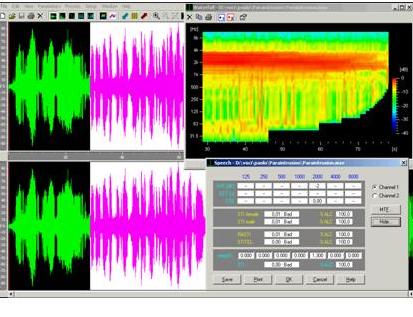
Fig. 1
The violet portions of oscillogram in Fig.1 are related
to the mysterious interference.
On top-right a sound coloured intensity (dB) spectrogram,
with Waterfall projection, is represented. On bottom-right
is shown the Speech Intelligibility analysis, based on seven
frequency bands.
It is pointed out as the signal is limited in a constant
band with a maximum of energy ranging from 1 to 4 KHz. With
the exception of some isolated peaks, it is not revealed
any signal at low frequency.
Presuming the sample to be a vocal articulation the signal
intelligibility is almost equal to zero (measured 0,01 Bad).

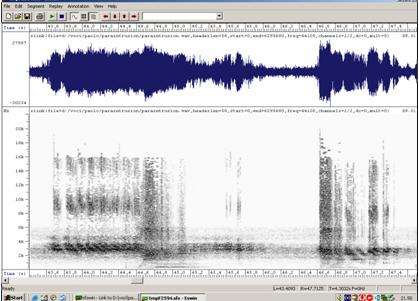
Fig. 2
By expanding the spectrogram scale to 20 KHz (the previous
one was set 0÷8 KHz), some bands with minor energy
are detected, 8÷12 KHz and 14÷16 KHz respectively.
The energy trend is undulatory, as shown in the spectrogram,
and similar to the one produced by a sampler and an electronic
synthesizer.
-- Voice report for Sound Paraintrusion --
Date: Mon Apr 3 21:45:54 2006
Time range of SELECTION
From 53.061003 to 69.128389 seconds (duration: 16.067386
seconds)
Pitch:
Median pitch: 274.774 Hz
Mean pitch: 305.748 Hz
Standard deviation: 113.124 Hz
Minimum pitch: 137.250 Hz
Maximum pitch: 499.675 Hz
Pulses:
Number of pulses: 482
Number of periods: 432
Mean period: 3.362400E-3 seconds
Standard deviation of period: 1.358713E-3 seconds
Voicing:
Fraction of locally unvoiced frames: 74.860% (1203 / 1607)
Number of voice breaks: 27
Degree of voice breaks: 84.930% (13.645969 seconds / 16.067386
seconds)
Jitter:
Jitter (local): 6.854%
Jitter (local, absolute): 230.451E-6 seconds
Jitter (rap): 3.613%
Jitter (ppq5): 4.314%
Jitter (ddp): 10.838%
Shimmer:
Shimmer (local): 15.891%
Shimmer (local, dB): 1.380 dB
Shimmer (apq3): 8.867%
Shimmer (apq5): 11.490%
Shimmer (apq11): 14.880%
Shimmer (dda): 26.601%
Harmonicity of the voiced parts only:
Mean autocorrelation: 0.598294
Mean noise-to-harmonics ratio: 0.713393
Mean harmonics-to-noise ratio: 1.809 dB
The analyses reveal the impossibility to classify the sample
as a natural voice since the 74% of sound articulation is
not recognizable as a voice. In addition the Signal/Noise
ratio (1.8 dB) is not acceptable for an accurate analyses
of the electroacoustical parameters like formants and for
calculating the relevant the Linear Prediction Coefficients
(LPC) and Cepstrum.
Fig. 3
Fig. 3 shows the F0 Statistic report extrapolated from
a perceptive tonic vowel \A\. The relevant values are rather
stationary and the presence of F0 is poor and fragmented;
as consequence such material is insufficient for a linguistic
analysis.
By using "Dr. Speech" software (recently acquired
by Il Laboratorio) only 0.72% of F0 can be considered within
the limits of parameters pertinent to a male speaker.
In the oscillogram shown in the bottom of Fig. 3 (represented
in red), it is evident the lack of F0. When F0 is detected
the oscillogram results coloured in green.
In Fig. 4 the pitch, marked by F0 in very short while only,
is analysed. It is characterized by some heavy tone variations
ranging between 1.5 and 7.6 ms.
Fig. 4
The pitch analysis evidences, in some frames only, high
temporal changes. The pitch, as reciprocal of fundamental
frequency F0 produced by the vocal cord vibrations, is represented
as average in milliseconds on left vertical scale.
Fig. 5
By using Dr. Speech software the analyses on the vowel
perturbation quotient resulted in the impossibility to be
accomplished due to the indefinableness and fragmentation
of F0. In addition such impossibility is due to the mixing
of tonal component of vowels into the noise in consequence
of the particular communication channel or the intrinsic
nature of signal (see warning advice on screen in Fig. 5).
By accomplishing the formant analyses, in Fig. 6 is shown
the IPA table with vowel dispersion area. All vowels are
located in the front labio-postalveolar and labio-palatal
areas.
Next Fig. 7 shows the analysis performed, using wavelet
modality, on a sample fragment where a noise with a "small
waves" pattern. It is highly similar to a signal processed
by a vocal synthesizer.
In the following a statistical calculation of formants
F1/F3 changes in the time (variable 1) is reported. Such
formants result to be uncertain and stationary.
Fig. 6
Fig. 7
CONCLUSIONS
The instrumental analyses performed using data processing
systems evidenced the only presence of physical characteristics
uncommon in a human voice like vocal cords frequency F0
and trajectories of formants Fn.
The presence of heavy noise in those bands (Fn) causes
uncertainties in the values distribution then difficulties
arise to choose suitable specific algorithms, like Cepstrum
on formants, required to reach a clear spectral view necessary
to extract the characteristic frequency range of each selected
phoneme.
The detected anomalies, like F0 values and formant statistics,
may be considered as intrinsic peculiarities of the analysed
signal or, taking into account the heavy spectral deterioration,
similar to the one used in many processors for acoustical
effects (synthesizers), such signals may be also considered
as an acoustic sample artificially manipulated.
By considering the impossibility to perform an accurate
parametric analysis, the doubt if the signal analysed may
be considered as a processed signal by a synthesizer or
an EVP still remains.
I don't have patterns with expansion of variables for analysing
the particular characteristics of synthesised signals, anyway,
for what I know, it is my opinion that it is possible to
create, by using a synthesizer, vocal spectra more similar
to the human voice in spite of what I found in the above
analysed sample.
The Technical Consultant
Daniele Gullà
<<
Return to Index |